April is Fair Housing Month, which commemorates The Fair Housing Act. Enacted on April 11, 1968, it prohibits discrimination in the sale, rental, and financing of housing based on race, color, national origin, religion, sex, familial status, or disability.
This year, CommunityScale looked at housing through the lens of housing costs as a percentage of household income by race and ethnicity (possible because of the B25140 “Housing Cost Burden” ACS tables introduced last year with iterations B25140A through B25140I).
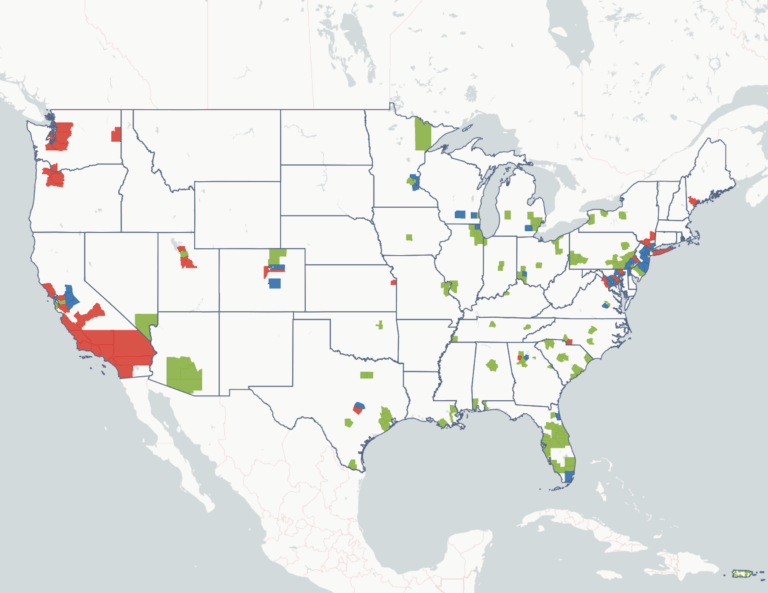
We looked at this across more than 600 large U.S. counties to compare places with housing unit growth over the past decade and then also across thousands of municipalities to measured what share of each racial group earns enough to buy the typical home price.
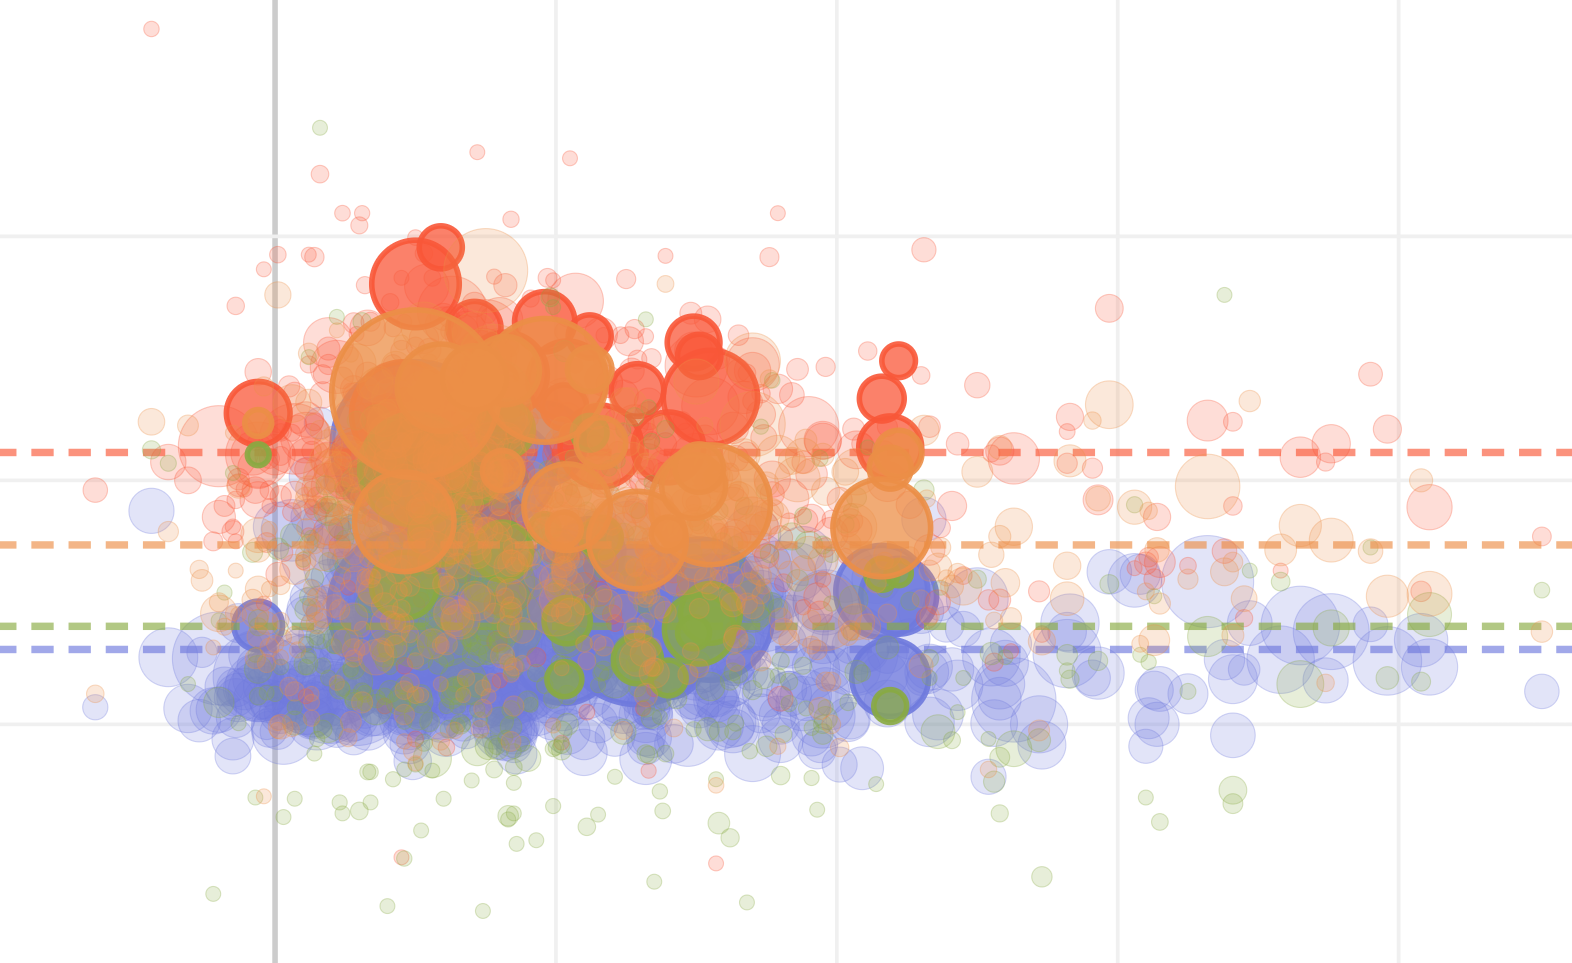
The scatter below plots housing unit growth (2015 to 2024) against cost burden rates for every U.S. county with at least 100,000 residents. Use the toggle buttons to switch between racial and ethnic groups.
Cost burden remains stubbornly high across much of the country, and the racial gap is visible at every growth level. Black households face higher cost burden than White non-Hispanic households in slow-growing counties and fast-growing ones alike.
Our second analysis investigates each municipality with at least 10,000 residents. We estimated the income required to buy the typical home using observed home prices, mortgage rates, taxes, and insurance. We then asked what share of each racial group earns enough that the typical home would fall at or below the standard 30% housing cost threshold.
Between 2019 and 2024, every group lost ground. White non-Hispanic households fell from 70.4% clearing the income bar to 55.5%. Black households fell from 52.8% to 38.2%. Hispanic households fell from 58.5% to 44.9%. The market deteriorated for everyone, but it did so on top of a racial gap that was already there and remained.
The decline hit all groups roughly equally in percentage-point terms (13 to 15 points). The disparity is not growing, but it is not closing either. The affordability crisis layered on top of a pre-existing income gap.
Look up your community: app.communityscale.io