Last week, Anthropic published “Labor market impacts of AI: A new measure and early evidence,” a research paper that takes a novel approach to a question every community should be asking: which jobs are actually being affected by AI today, not just which ones theoretically could be?
Their key insight is the gap between theoretical AI capability and observed AI adoption. While 94% of tasks in Computer & Math occupations could theoretically be accelerated by AI, only 32% are actually seeing significant AI usage in professional settings. Office & Admin roles show the highest observed adoption at 42%, followed by Computer & Math (32%) and Business & Finance (28%). On the other end, physical and in-person occupations like agriculture (2%), food service (2%), and grounds maintenance (2%) remain largely untouched.
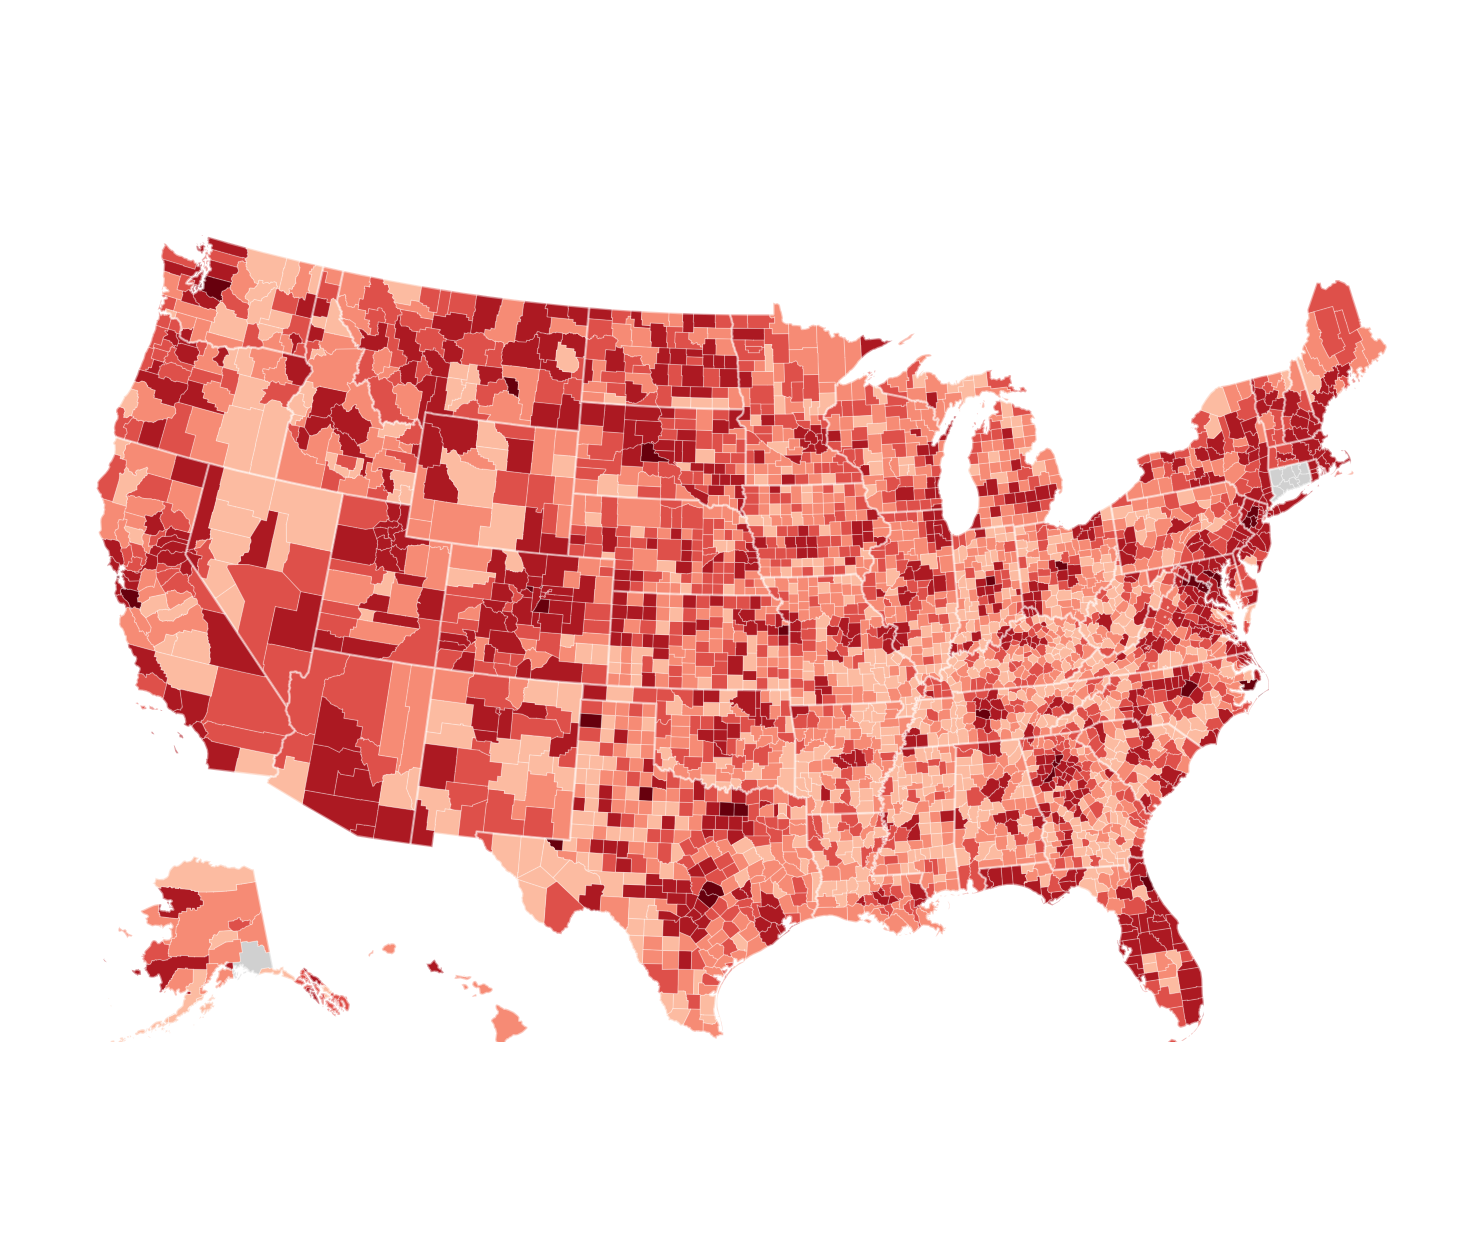
These occupation-level differences matter enormously at the community level, because every county has a different workforce mix. A county dominated by office and technology jobs will feel AI’s effects much sooner than one built around agriculture and manufacturing.
To see how this plays out geographically, we weighted each county's occupation mix (from the 2024 ACS 5-Year estimates, table C24010) by Anthropic's observed AI coverage rates. The result is a composite AI exposure index for every county in the country, covering 162 million workers across 3,222 counties.
The geographic pattern is striking. The highest-exposure counties cluster in the places you'd expect: the knowledge-economy corridors around Washington, D.C., San Francisco, and other major metros. Arlington County, VA leads among large counties at 20.4%, driven by its concentration of federal contractors, consulting firms, and technology companies. Neighboring Loudoun County, VA (20.2%) and Fairfax County, VA (19.2%) are close behind, forming a Northern Virginia corridor where roughly one in five workers' tasks overlap with current AI capabilities.
Other high-exposure counties include San Francisco (19.0%), Manhattan (18.8%), Santa Clara County (18.5%, home to Silicon Valley's nearly one million workers), and King County, WA (18.4%, the Seattle metro). The common thread is a workforce heavy on management, business, finance, and technology roles.
At the other end, rural counties with economies built around agriculture, manufacturing, and physical labor show exposure rates in the low teens or single digits. The national employment-weighted average sits at 15.6%, meaning the typical American worker is in a county where about one in six job tasks has meaningful AI overlap today.
What this means for communities
The Anthropic research found no systematic increase in unemployment for highly AI-exposed workers since late 2022, though there is suggestive evidence that hiring of younger workers (ages 22 to 25) has slowed in the most exposed occupations. This is not a crisis today. But it is a signal, and one that communities should take seriously for three reasons.
Workforce concentration creates vulnerability. Counties where a large share of workers are in AI-exposed occupations face correlated risk. If AI capabilities advance and adoption deepens (as they almost certainly will), the gap between Anthropic's "theoretical capability" and "observed exposure" will narrow. A county where 20% of tasks are already covered by AI could see that figure climb substantially as tools improve and deployment spreads. Communities with diversified workforces have more resilience built in.
AI exposure tracks with housing cost. The highest-exposure counties are, almost without exception, high-cost housing markets. San Francisco, Manhattan, Arlington, Santa Clara: these are places where housing affordability already depends on the high incomes that knowledge-economy jobs provide. Anthropic's data shows that workers in the most exposed occupations earn 47% more than those in unexposed roles. If AI disrupts these earnings, the housing markets that depend on them face a compounding challenge.
The young-worker signal matters for growing communities. The finding that entry-level hiring may be slowing in AI-exposed occupations is particularly relevant for communities that have been attracting young professionals. Places like Williamson County, TN (18.8% exposure, in the Nashville metro) and Douglas County, CO (19.2%, south of Denver) have seen rapid population growth fueled by young workers in exactly the kinds of jobs that show the highest AI adoption. If that pipeline of new workers slows, it affects everything from housing demand to municipal revenue projections.
Building on local data
This analysis is a starting point. The AI exposure index we've calculated reflects the current state of AI adoption, and as Anthropic notes, actual usage remains a fraction of what's theoretically possible. The gap between the blue bars (theoretical capability) and the red bars (observed exposure) in their research represents the future runway of disruption. As that gap closes, the geographic concentration of affected workers will only become more relevant for local planning.
Communities that understand their workforce composition have a head start. Explore your own county's workforce data on CommunityScale, and read the full Anthropic paper here.
Download a shareable social media card:
