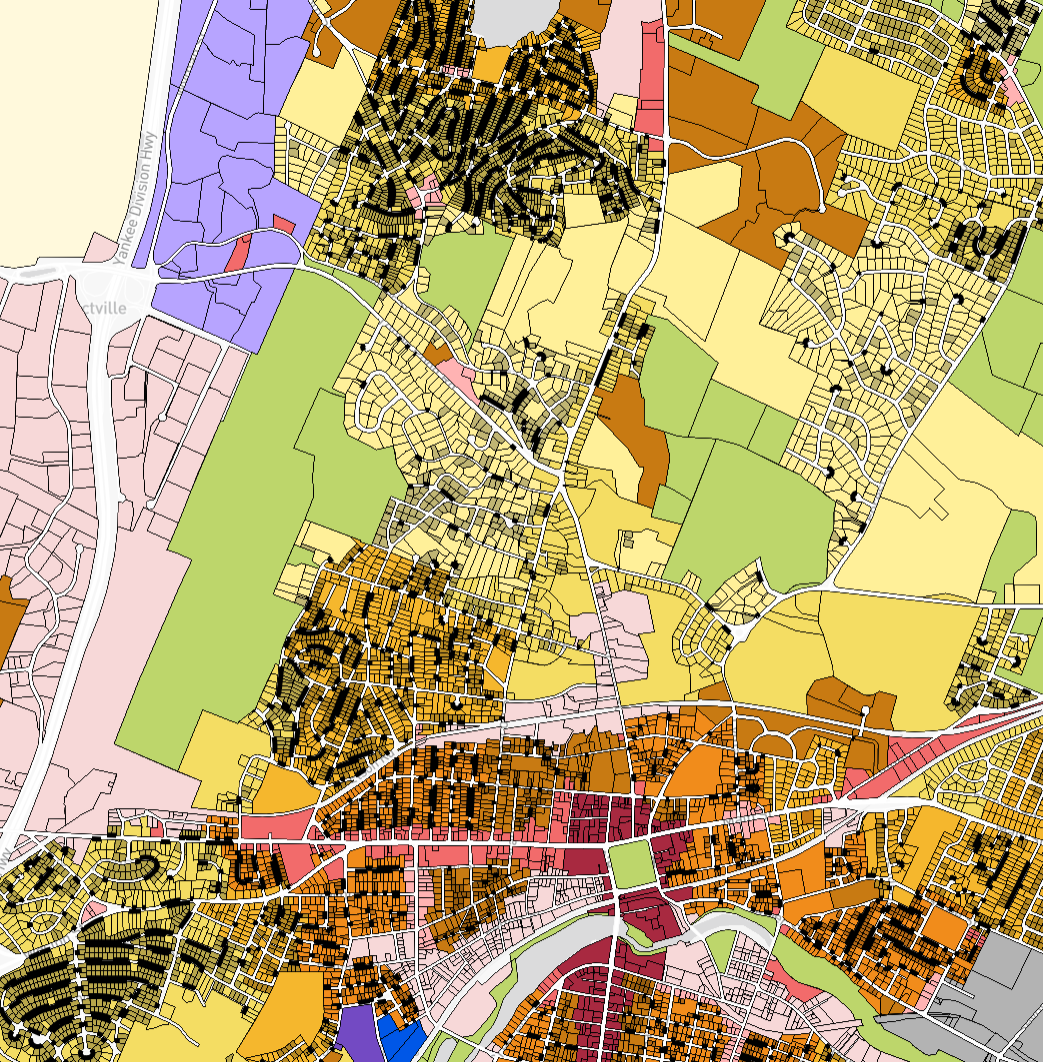
CommunityScale builds custom interactive web maps that let residents, planners, and elected officials explore a community’s zoning landscape alongside land use, parcel data, and development context. Built using an open source approach, these maps allow users to click on any parcel or zoning district to view dimensional standards, allowable uses, and related data. Maps can incorporate buildout analysis, compliance modeling, and scenario comparison, making them a powerful engagement tool during zoning updates and planning processes.
Interactive maps often accompany broader zoning and housing planning projects, helping communities visualize how use definitions, dimensional standards, and overlay boundaries relate to the built environment. They support transparency and public understanding at each stage of a project, from initial analysis through adoption.
Projects featuring interactive maps:
Related reading: