The information in this detailed housing market analysis is intended for the City to evaluate policies and programs that seek to grow the City responsibly and increase housing options for residents, whether they are forming a new household in Upper Arlington, entering as a new resident, or looking to remain in Upper Arlington through various life stages. This study provides a review of demographic trends, comparable communities, regional influences, and a quantitative deep dive into issues that shape the housing market. The analysis is grounded by interviews with stakeholders such as single-family and multifamily housing developers, regional and local government staff, and housing advocates, as well as an online survey with more than 700 responses.
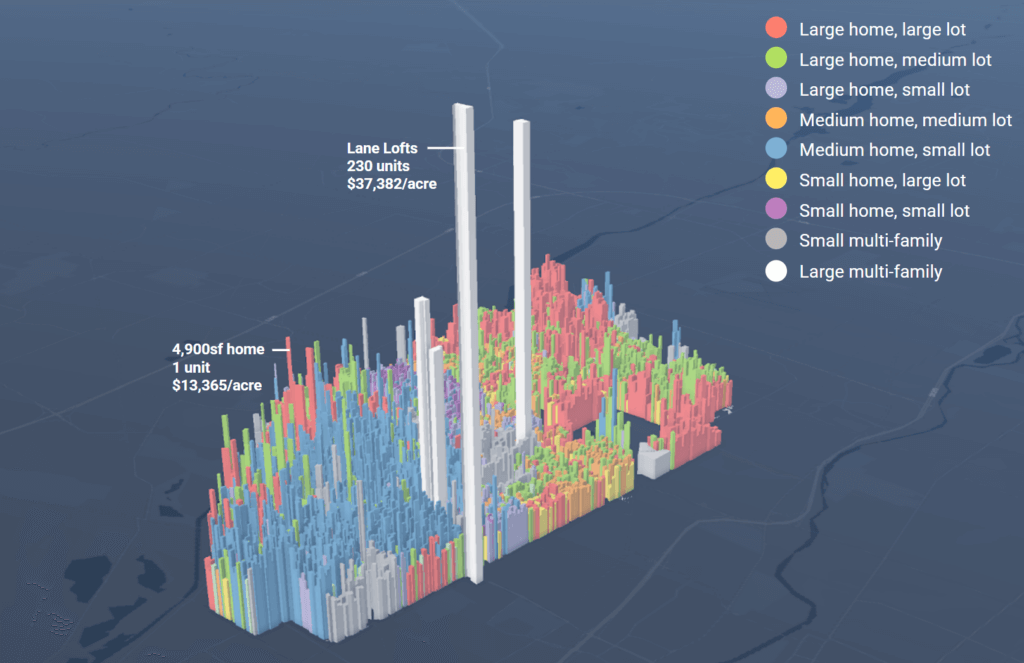
New homes in Upper Arlington generate municipal revenue exceeding service costs, thus providing a net positive impact on municipal finances. The break-even assessed value per unit is approximately $619K, current market values for new construction easily surpass. The marginal cost to serve a new home in Upper Arlington is a function of services that need to scale with new demand but are not inherently covered by their own fees. Police, fire, EMS, and Parks and Recreation are funded by the City’s general revenue, whereas other services like waste, water, and sewer are covered by fees connected to those services. These expenses are then balanced by revenues from property tax, income tax for work-from-home, and ongoing revenue positive building permit fees for redevelopment and renovation.
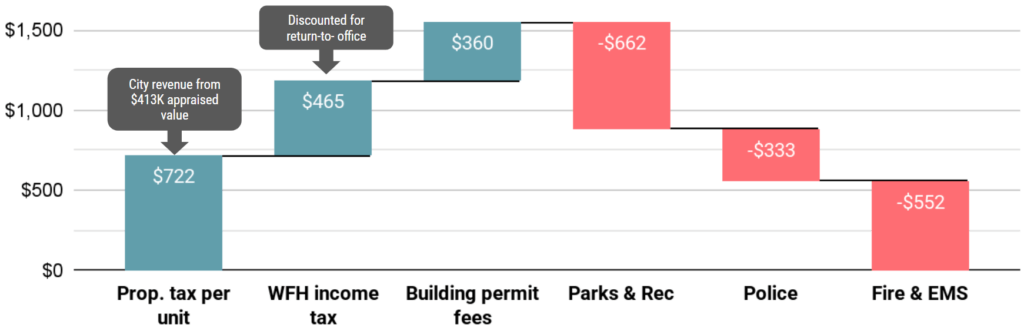
As cities grow, the cost of providing essential services per household decreases because the new homes leverage existing infrastructure and distribute expenses such as police, fire protection, and parks across more households. More precisely, the relationship between growth and overall expenses is nonlinear as cities achieve 15% efficiency gains in infrastructure and service provision. Larger cities can provide essential services like police, fire protection, and parks at a lower per-unit cost due to these economies of scale. For Upper Arlington, a 9.8% increase in housing units from 2025-2050 as forecasted by MORPC’s Metropolitan Transportation Plan would only require about 8.2% additional resources. This economy of scale effectively reduces the break even point for revenue from new homes for Upper Arlington.
Access the project’s landing page and detailed housing forecast.