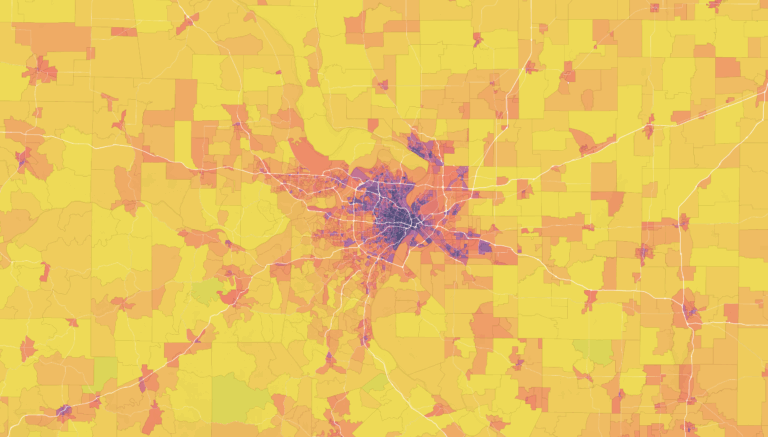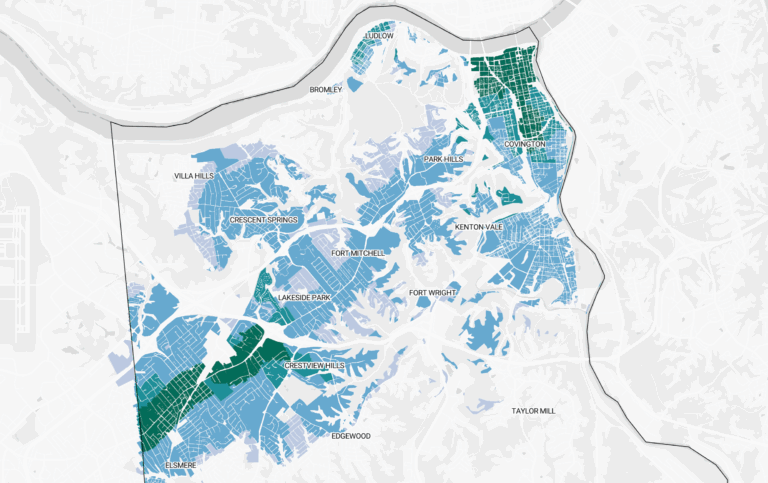
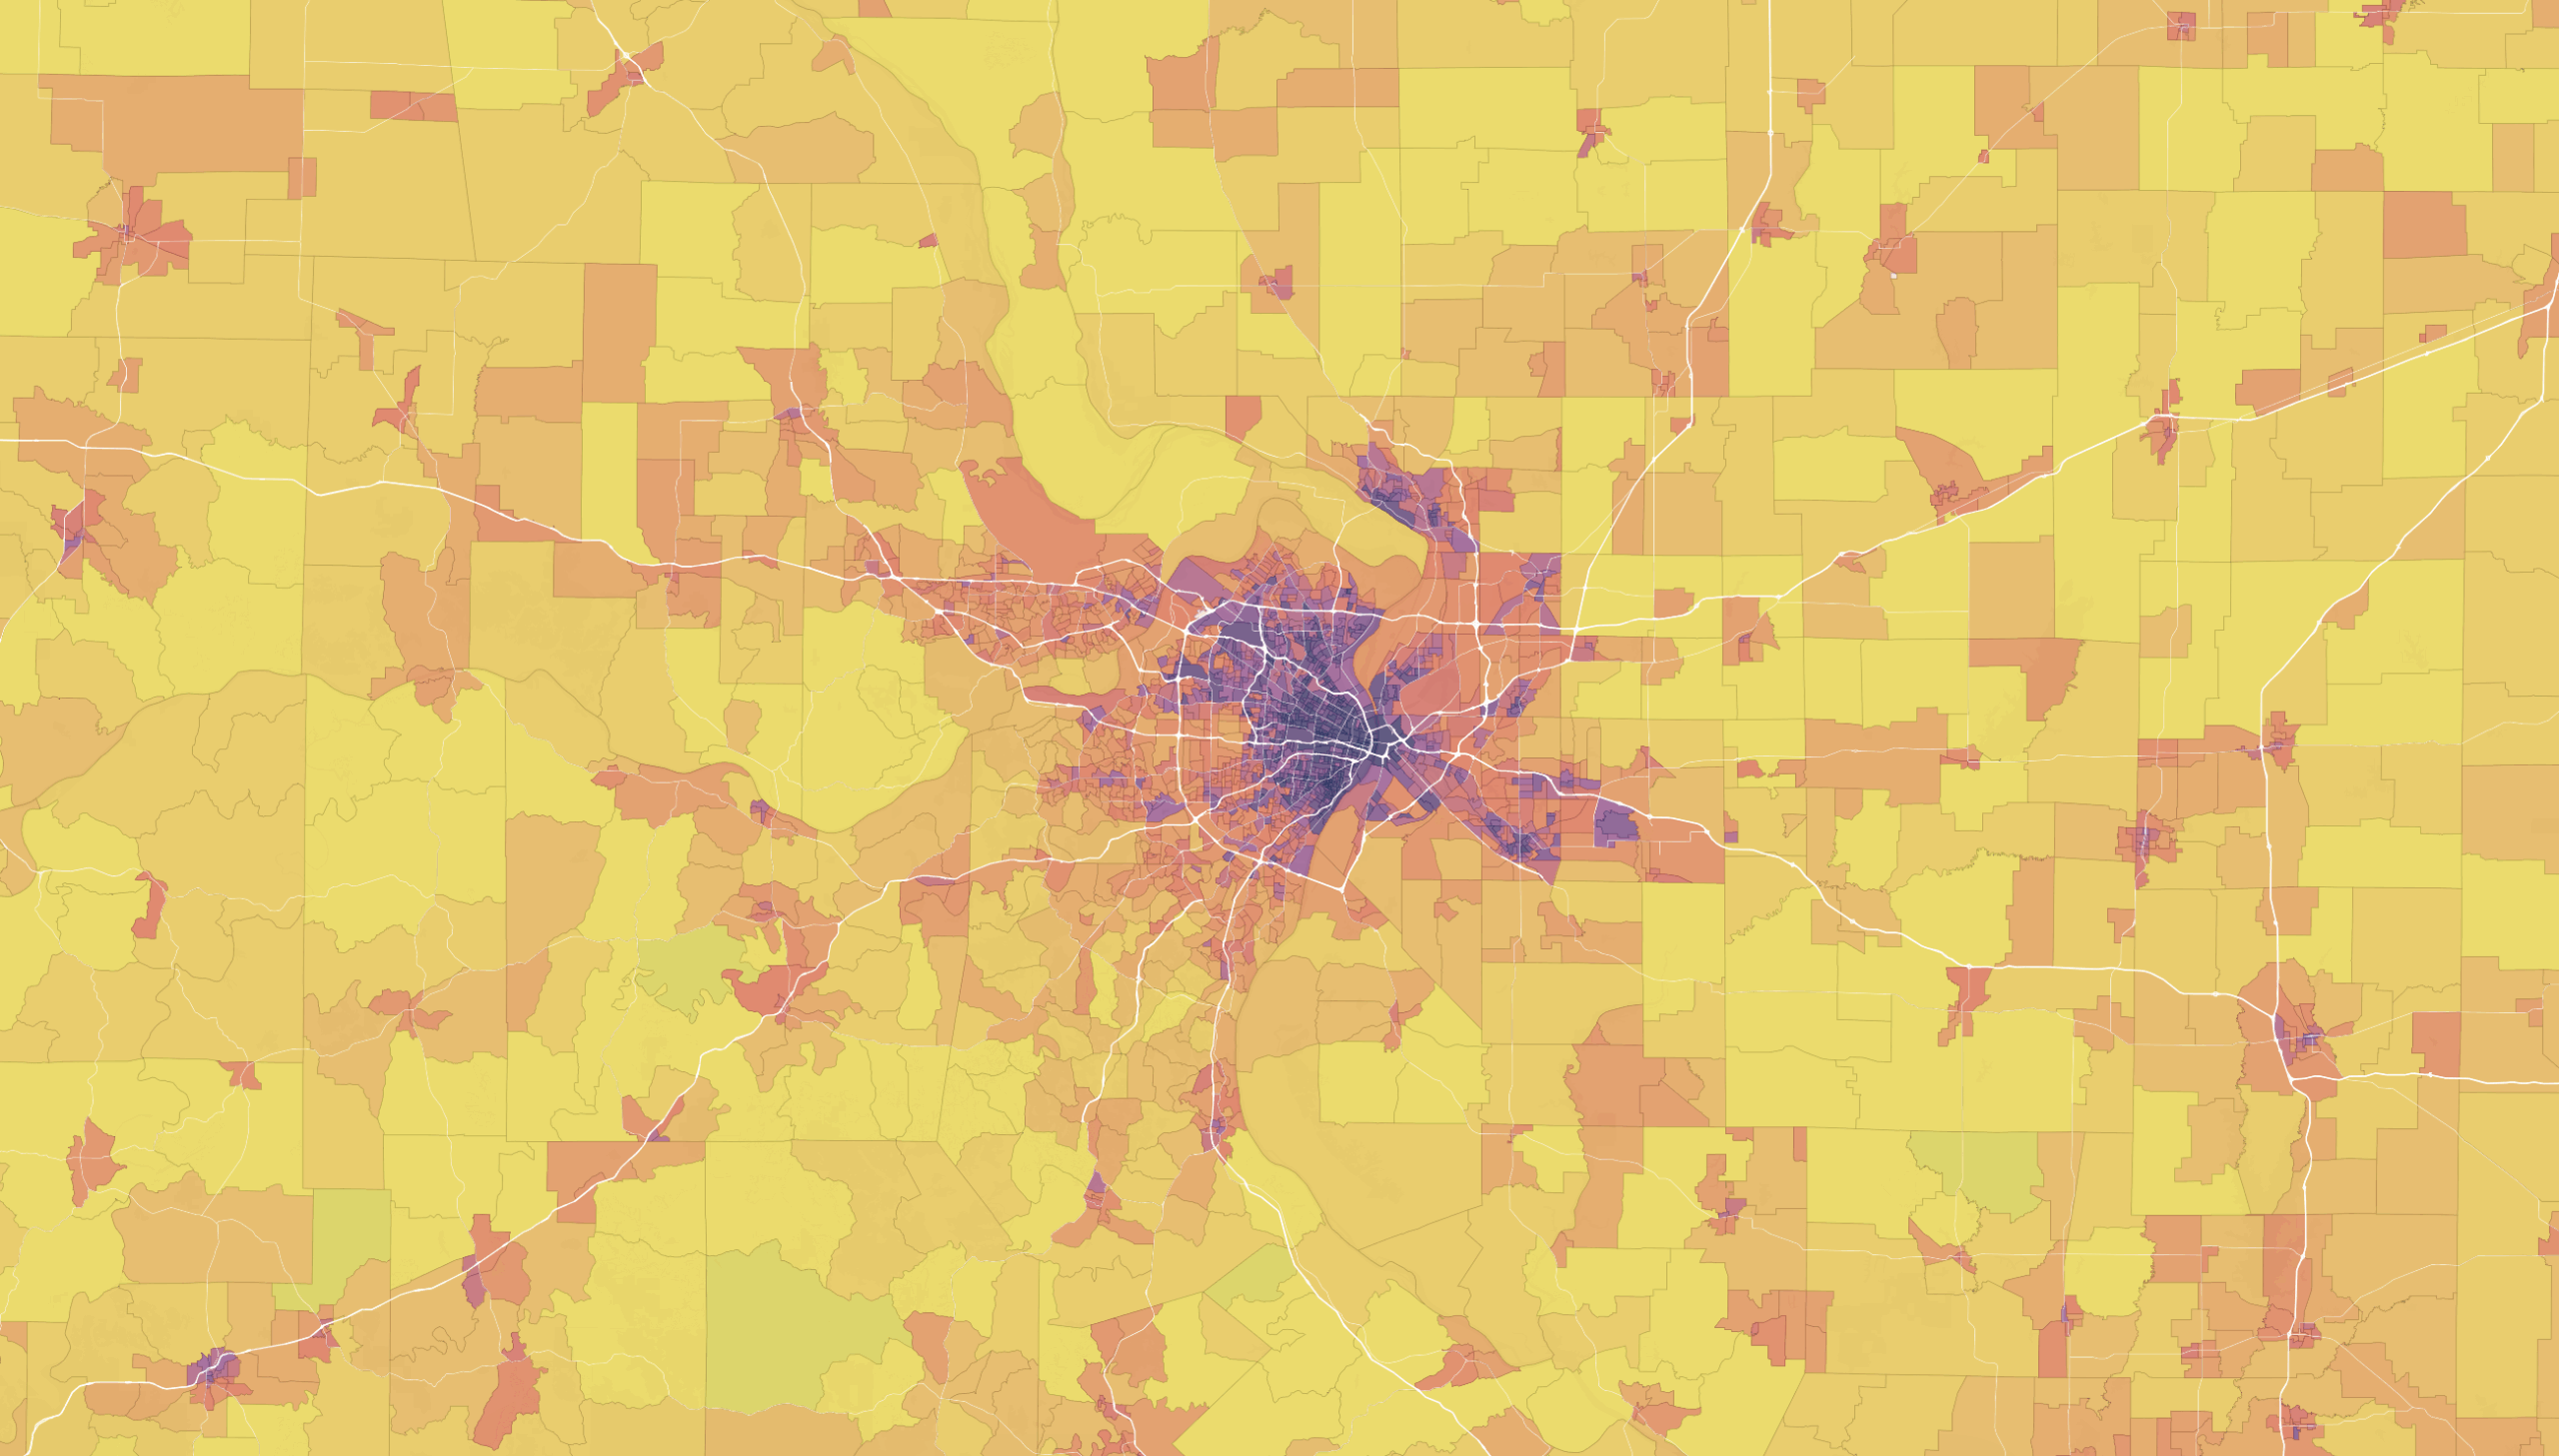
The Housing + Transportation (H+T) Affordability Index, built and maintained by the Center for Neighborhood Technology (CNT), measures housing and transportation costs together as a share of household income. The H+T identifies affordability when the housing and transportation together take no more than 45% of income, housing alone no more than 30%, transportation no more than 15%.
We built a version that refreshes on schedule with other data releases, including ACS and LODES, and uses odometer data from multiple states to model vehicle miles traveled (VMT). The refresh matters because CNT’s 2025 update runs on 2022 ACS data and the 2020-2024 ACS has since been released. National median household income alone moved from $75,149 to $80,734 between those two vintages. Our methodology is documented at docs.communityscale.io/docs/ht-index.
The H+T index predicts three behaviors from the built environment, cars owned per household, miles driven per household, and share of commuters using transit, and then prices them. Miles driven does the most work of the three, and CNT fits that piece on odometer readings from Illinois emissions testing for the Chicago and St. Louis metro areas, 2018 through 2020, matched into roughly 660,000 vehicle pairs. We obtained vehicle inspection odometer records from Colorado, Missouri, New York, and Oregon through public records requests, and cleaned all four into one schema. That is roughly 31 million paired readings across about 13.6 million vehicles. Each pair is two odometer readings on the same vehicle at two known dates, tied to where the vehicle is registered. More states are in progress.
What predicts how much people drive
One reason we built our H+T model was to ask deeper questions with the built-environment layer, the odometer data, and a national feature set to understand what actually separates a place where households drive 10,000 miles a year from one where they drive 25,000. Some high level initial findings:
- Household income by itself is not predictive once household size, number of commuters, and the built environment are accounted for.
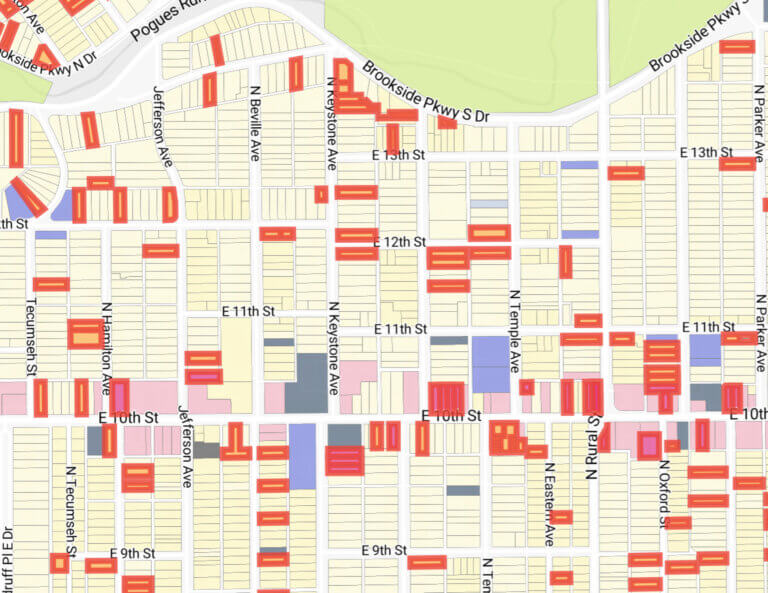
- The most decisive term in the model is the distance-weighted intensity housing in the surrounding area. Interestingly, a dense neighborhood surrounded by low-density neighborhoods still produces a lot of miles driven.
- Transit frequency is more important than transit proximity.
Overall results from the index
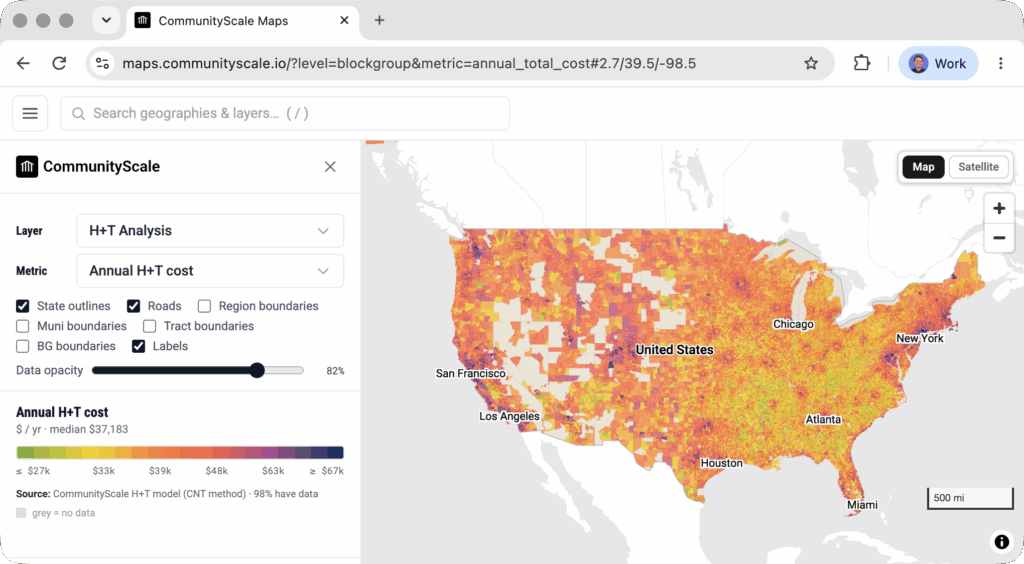
For the national typical household, at the 2020-2024 median income of $80,734, the median American block group spends 24.7% of income on housing and 21.5% on transportation, for a combined 46.1%. Median modeled driving comes out at 17,690 miles per household per year, ranging from about 800 in the densest block groups to just over 31,000 in the most car-dependent ones. The range, nearly forty to one, is an argument for why transportation belongs in an affordability calculation.
Our validation against CNT’s index can be found in our methodology documentation. You can pull up any block group in the country on the atlas, switch between annual driving, transportation share of income, and the combined H+T share, and see it for a specific place.