The figure most people cite as the U.S. homeownership rate, about 65 percent, is technically the owner-occupancy rate: the share of occupied housing units in which the owner lives. It counts homes, not people. The Federal Reserve Bank of Minneapolis recently proposed a complementary measure, the homeowners-to-population ratio, or HPOP, which counts people instead. By that measure, about 53 percent of American adults own their home.
What HPOP measures
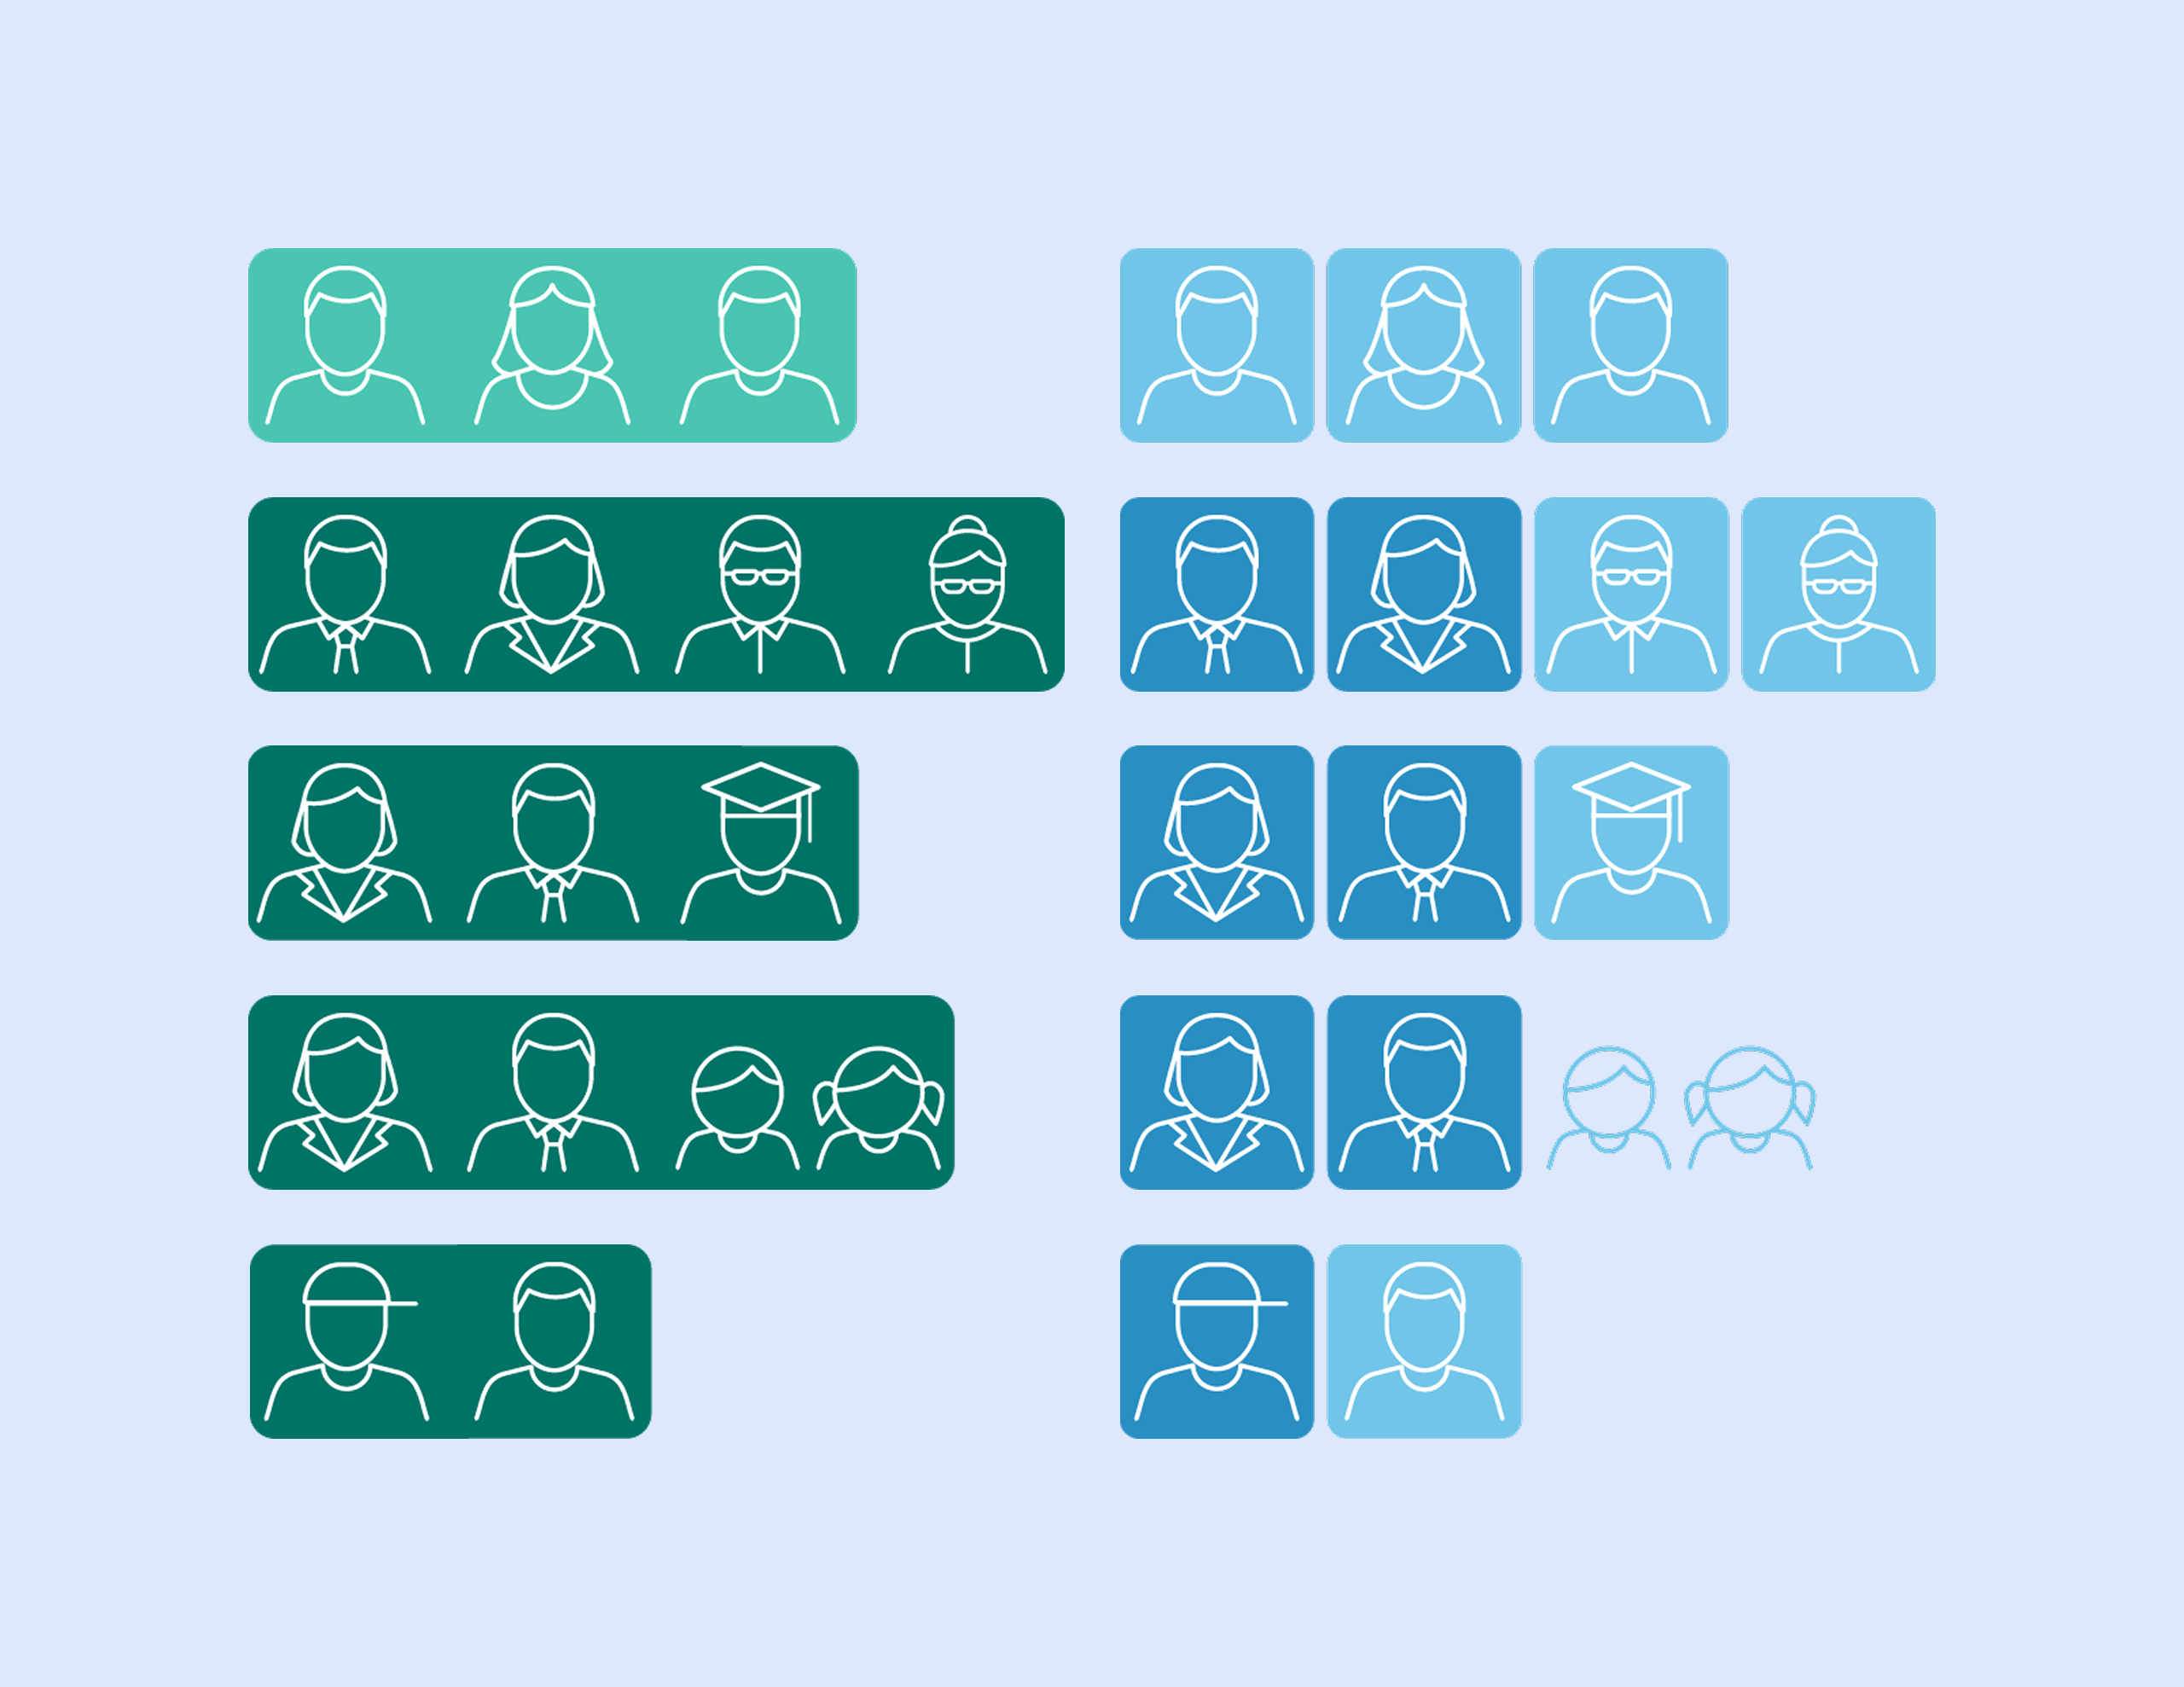
HPOP is the share of adults, everyone aged 18 and older, who own the home they live in. The difference from the owner-occupancy rate is in what each one counts. The owner-occupancy rate treats a house shared by a homeowning couple, their two adult children, and a grandparent the same as a studio with one owner: both are a single owner-occupied unit. HPOP counts each adult.
Two groups that the owner-occupancy rate sets aside are counted in HPOP. The first is adults who live in an owner-occupied home without owning it, such as adult children living with their parents, a co-residing relative, or a roommate. The Minneapolis Fed finds that nationally about one in eight adults falls into this group. The second is adults who live in group quarters, such as college dormitories, nursing homes, and correctional facilities, whom the owner-occupancy rate leaves out entirely.

Why the Minneapolis Fed introduced it
The Minneapolis Fed’s stated reason is that measuring homeownership by the person rather than by the housing unit gives a more accurate picture when comparing groups, particularly by age. The owner-occupancy rate assigns each household the age of its reference person, so younger adults who live with parents or in dormitories are not reflected in it. The Fed reports that the owner-occupancy rate for households headed by someone under 35 was about 37 percent in 2024, while HPOP for adults under 35 was about 22 percent.
The Minneapolis Fed publishes HPOP for the nation, all 50 states, and metropolitan areas, for every year the American Community Survey has collected the data, from 2006 through 2024, along with breakdowns by age, race and ethnicity, and marital status.
Homeownership by neighborhood
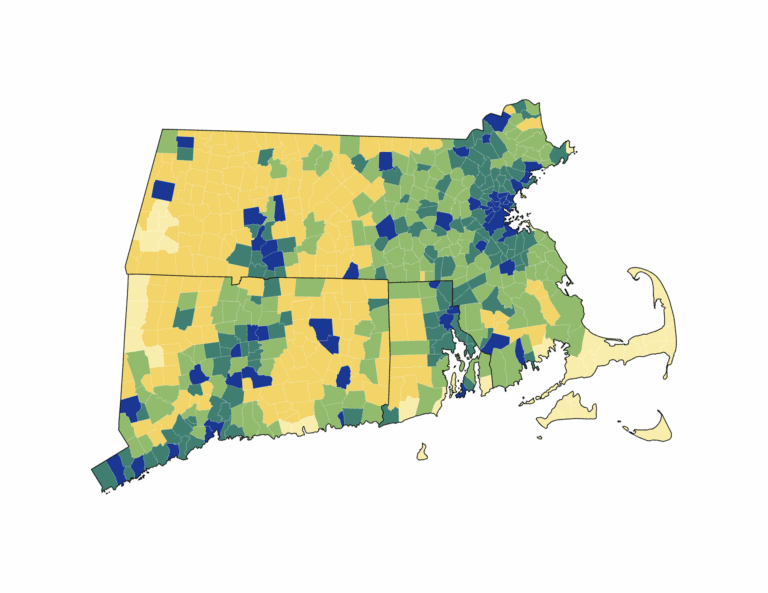
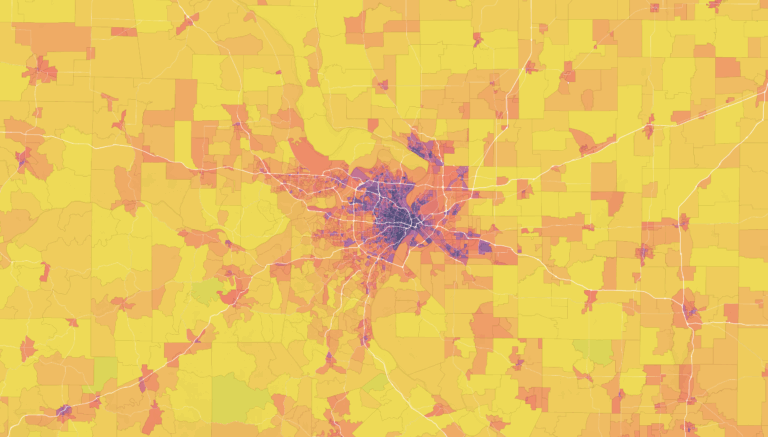
Measured this way, homeownership varies widely across the country. We computed HPOP for every Public Use Microdata Area, the Census statistical areas of roughly 100,000 people that microdata is reported for, using the same American Community Survey data the Minneapolis Fed uses. Hover over any area on the map to see its value.

The pattern is consistent with the national numbers. The share of adults who own their home is highest across the Upper Midwest, the Great Plains, Appalachia, and rural areas generally, and lowest in dense, high-cost coastal metropolitan areas and around large universities. In 2024 the value ranged from under 20 percent in some urban areas to above 70 percent in some rural ones.
Explore the full map and the method
The map above is a static snapshot; the same data is available as a zoomable layer, “Homeownership by people (HPOP),” on the CommunityScale atlas. Our full methodology, including how we identify homeowners and aggregate the microdata, is documented on our HPOP methodology page, which also links to the Minneapolis Fed’s original article and data release.