Back in May, U.S. News published its 250 Best Places to Live in the U.S. for 2026-2027, and the winner’s circle includes Carmel, Indiana, Fishers, Indiana, Flower Mound, Texas, and Ankeny, Iowa. The methodology rewards value, job market strength, desirability, and quality of life, and that mix points squarely at mid-sized suburbs in the middle of the country.
We loaded all 250 ranked places into our data platform to see what the rankings look like through a housing supply lens. By our supply calculations, the incorporated cities and towns on this list need more than 1.1 million additional homes by 2031 just to keep up with their own projected growth, replacement needs, and healthy vacancy.
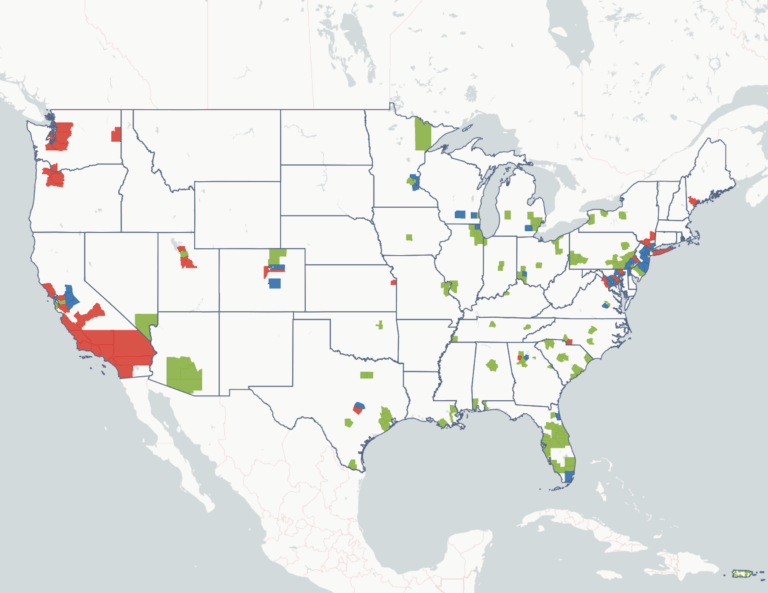
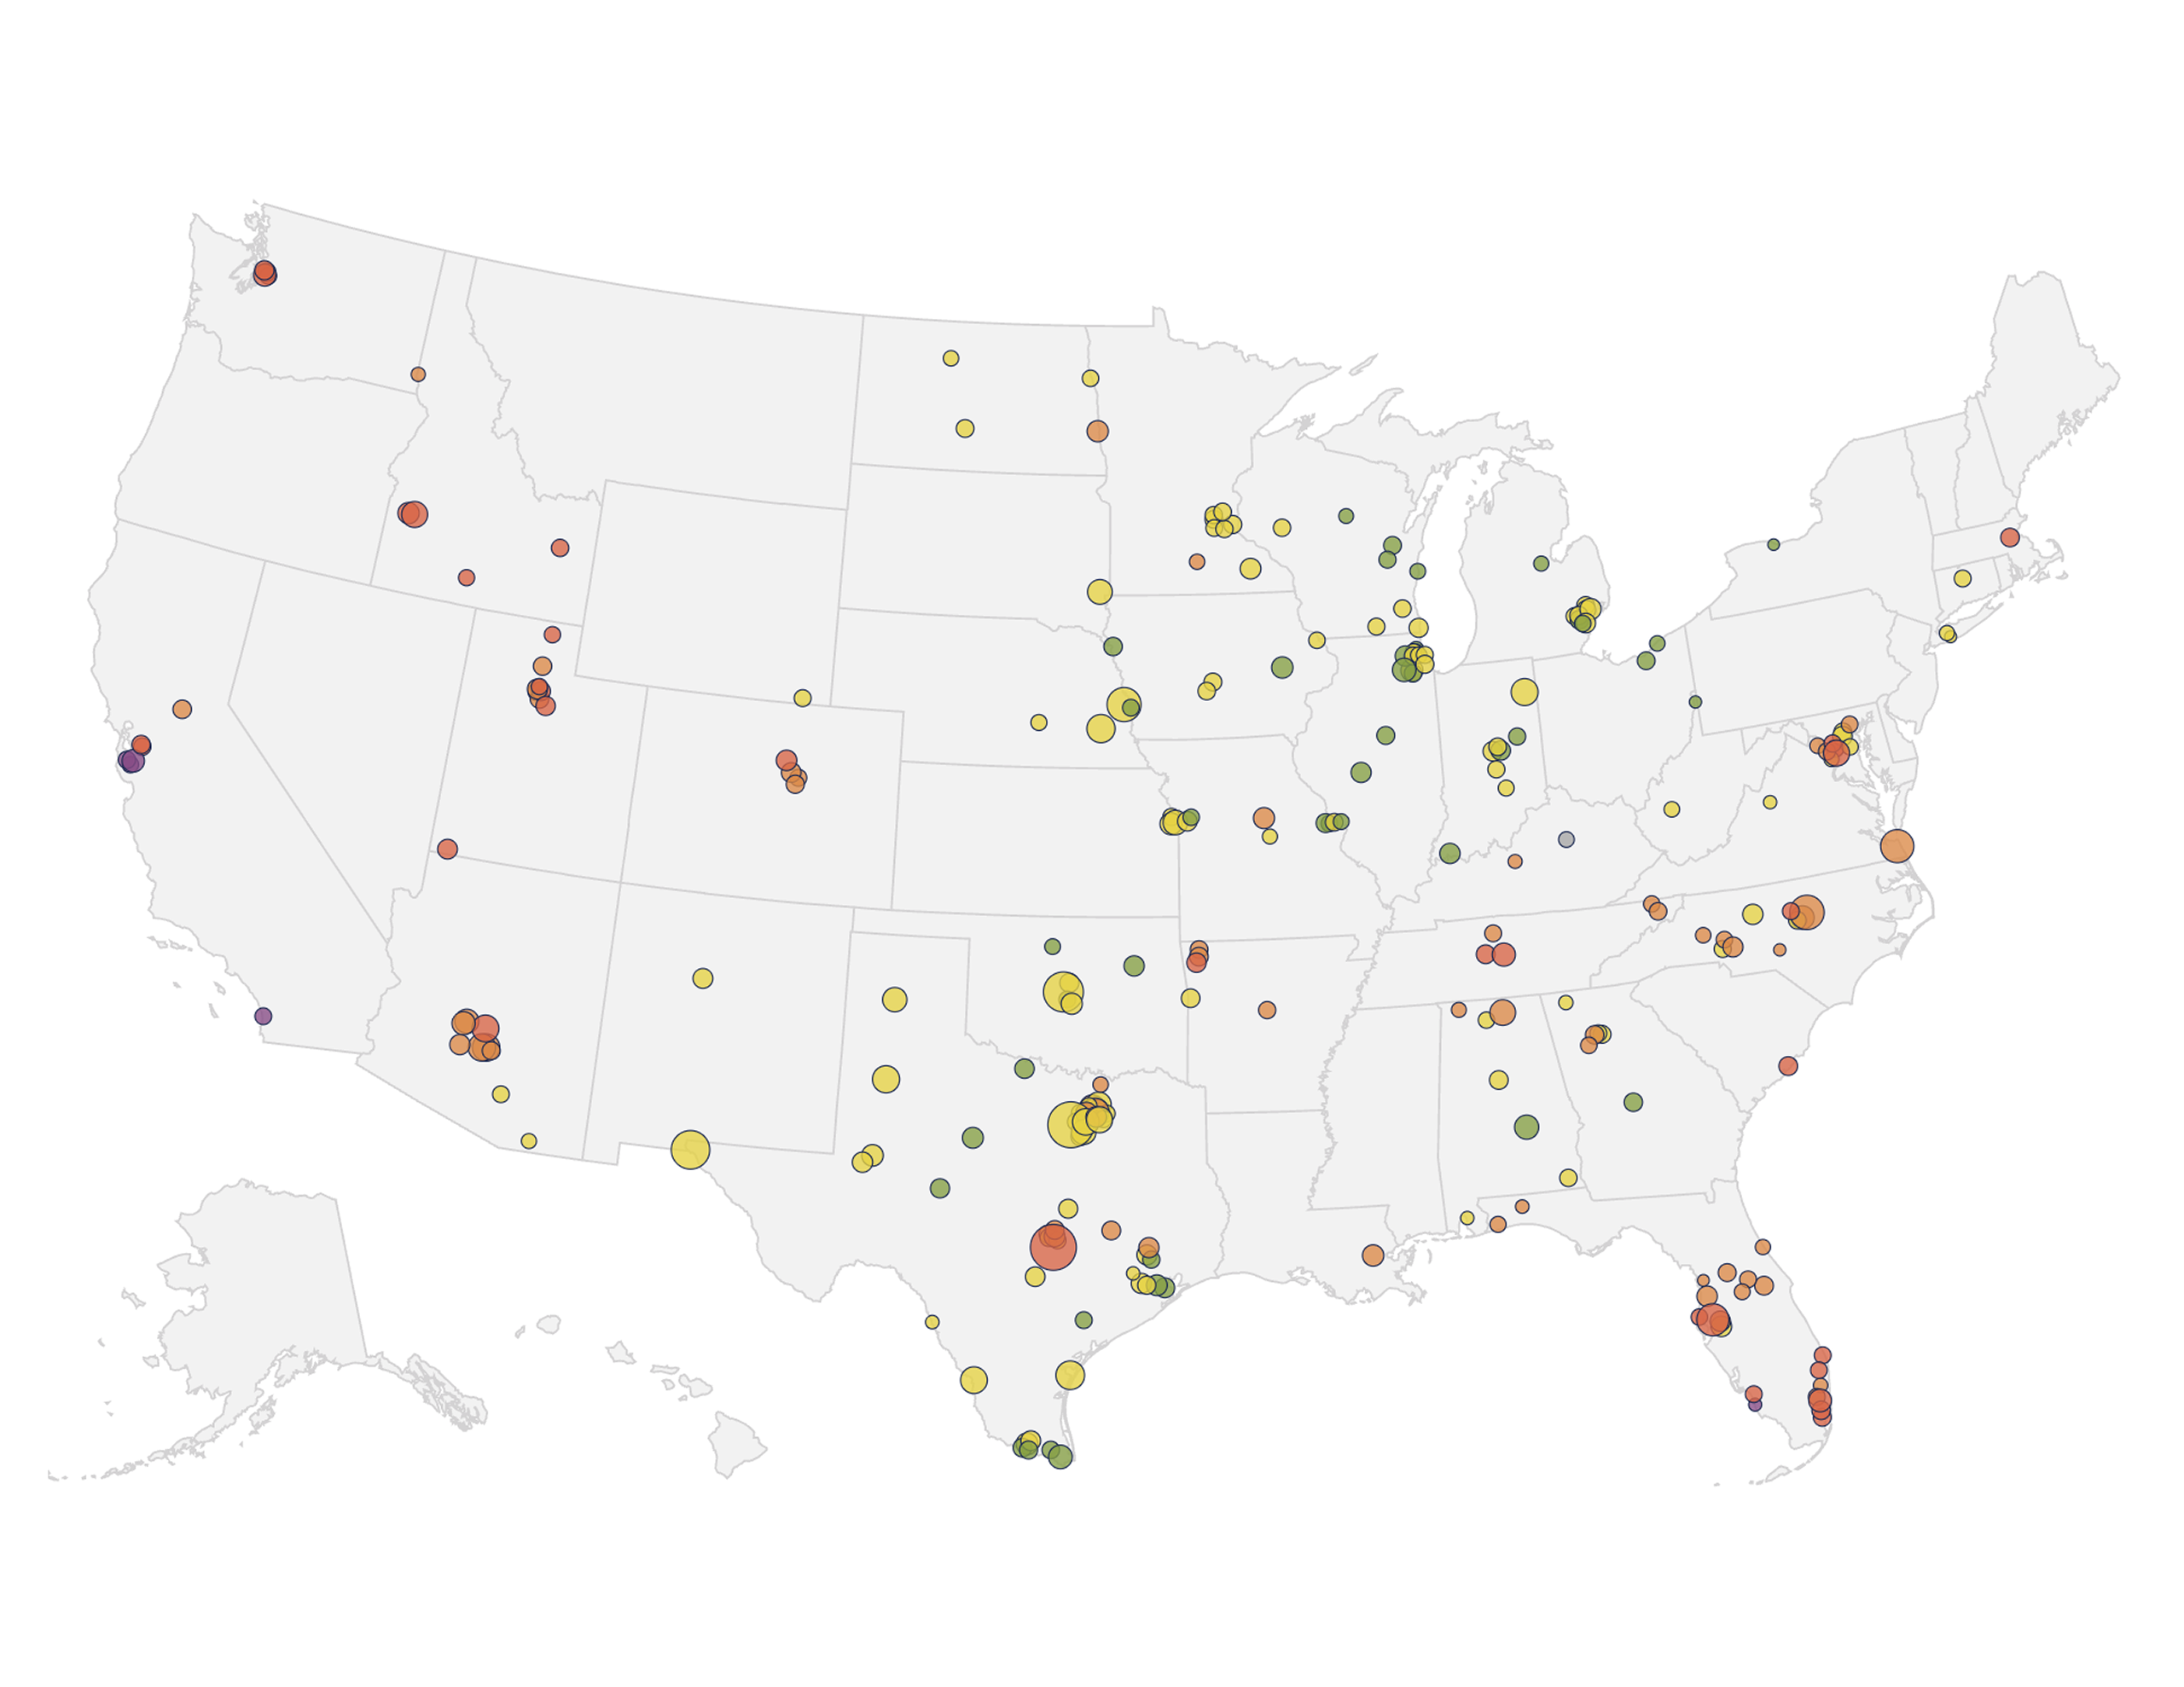
Where the best places are
The 250 places span 37 states. Texas alone lands 53 places on the list, Florida 22, and Illinois 13. The median ranked place is home to about 80,000 people, and only five (El Paso, Oklahoma City, Fort Worth, Raleigh, and Austin) top half a million. New York, Los Angeles, Chicago, and Boston didn’t make the list, though their suburbs did.
The best places to live, as U.S. News defines them, are mostly the suburban rings of Sun Belt and Midwest metros, such as the Dallas-Fort Worth and Houston suburbs, the collar towns around Indianapolis, Kansas City, Minneapolis, and Chicago, and Florida’s Gulf Coast.
Affordability a key ingredient
Plotting each place’s median household income against its median home value shows how much of the “best places” formula is an affordability screen.
Across the 249 places with published stats, the median home costs about 3.7 times the median household income. That is close to what most lenders consider the edge of comfortable for a typical buyer, and it is far healthier than the big coastal metros that didn’t make the list.
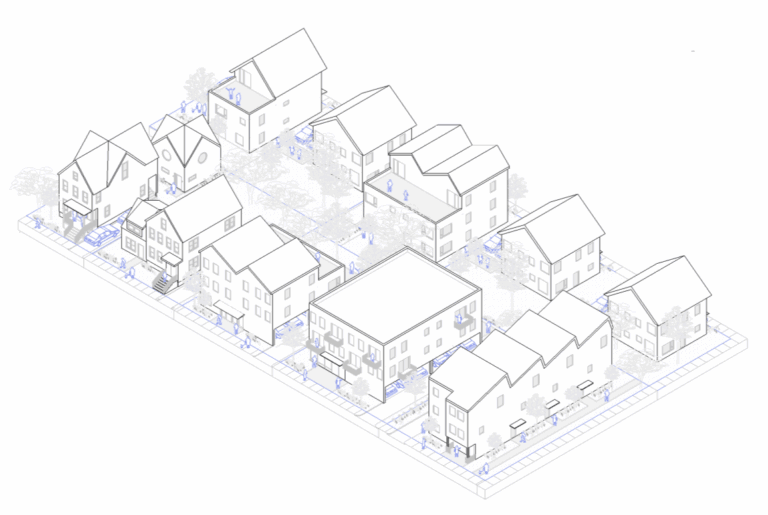
1.1 million homes by 2031
For every municipality on the list, our platform computes a five-year housing supply target, which is the homes needed to absorb projected household growth, replace units lost from the stock, and restore healthy vacancy so prices stop climbing. We explain the method in Housing shortage and equilibrium calculations.
Summed across the 230 incorporated places, the target comes to roughly 1.13 million homes between 2026 and 2031. Top-ranked Carmel alone needs about 2,945 homes over five years, roughly 589 a year added to a stock of about 40,900 units. Frisco, Texas (#9) needs about 23,400. Queen Creek, Arizona (#103) is forecast to grow 36 percent by 2031, the fastest on the list, and needs about 11,300 homes to stay ahead of it.
19 of the best places are unincorporated
One detail jumped out when we matched the list against our database: 19 of the 250 “places” are not cities or towns at all. They are census-designated places, unincorporated communities counted by the Census Bureau but governed by their counties. That includes some of the most recognizable names on the list: The Woodlands, Texas (#28), Bethesda, Maryland (#50), Columbia, Maryland (#189), Reston, Virginia (#169), and The Villages, Florida (#186).
Keep on winning
The suburbs at the top of this list got there because, at some point, they permitted enough homes for teachers, nurses, and young families to move in. However, the same demand that earns a place a top-250 badge pushes prices up, and the communities that respond by building hold onto their affordability while the ones that don’t slide toward the Palo Alto end of our scatter plot.
Every place on this list, and every place that isn’t, has a free CommunityScale dashboard with its population forecast, cost burden profile, affordability gap, and five-year supply target. Find yours at app.communityscale.io, or click any dot on the map above.
Rankings and place-level income, home value, rent, and population figures are from U.S. News Best Places to Live 2026-2027. Cost burden, forecasts, and housing supply targets are CommunityScale calculations from our housing data platform.