CommunityScale recently completed a housing study and strategic action plan for the Will County, IL Center for Economic Development (CED) to provide a data-driven framework for CED to promote housing that meets the needs of local communities and supports jobs and economic growth.
Will County is losing out on young professionals compared to neighboring counties, which have attracted Chicago commuters and new business growth along with them. These young people are more likely to want diverse housing options, like condos and apartments, and to live in places that have walkable access to amenities and transportation. We used geospatial analyses to understand the best locations to build new, diverse housing and to guide strategies for different areas.
Housing Location Suitability Analysis
First, our Suitability analysis identifies the places that are most suitable for new housing, based on proximity to jobs, services, transit, and infrastructure. In Will County, we started with an environmental screening that filtered out conserved land and other unbuildable areas. Next, we layered municipal boundaries, which generally represent the extent of public sewer and water infrastructure in this region.
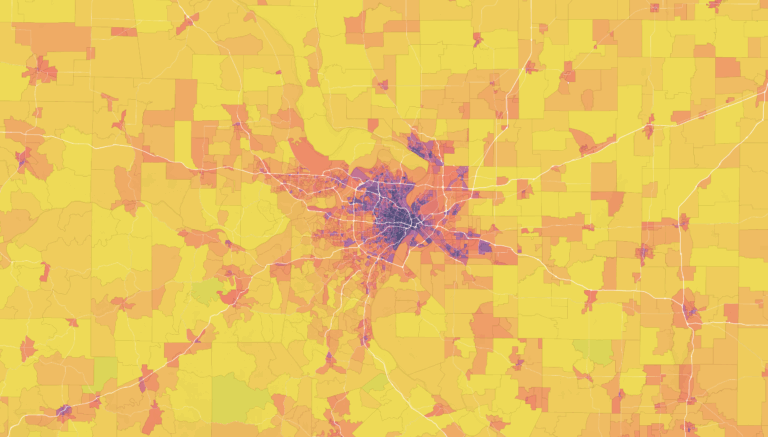
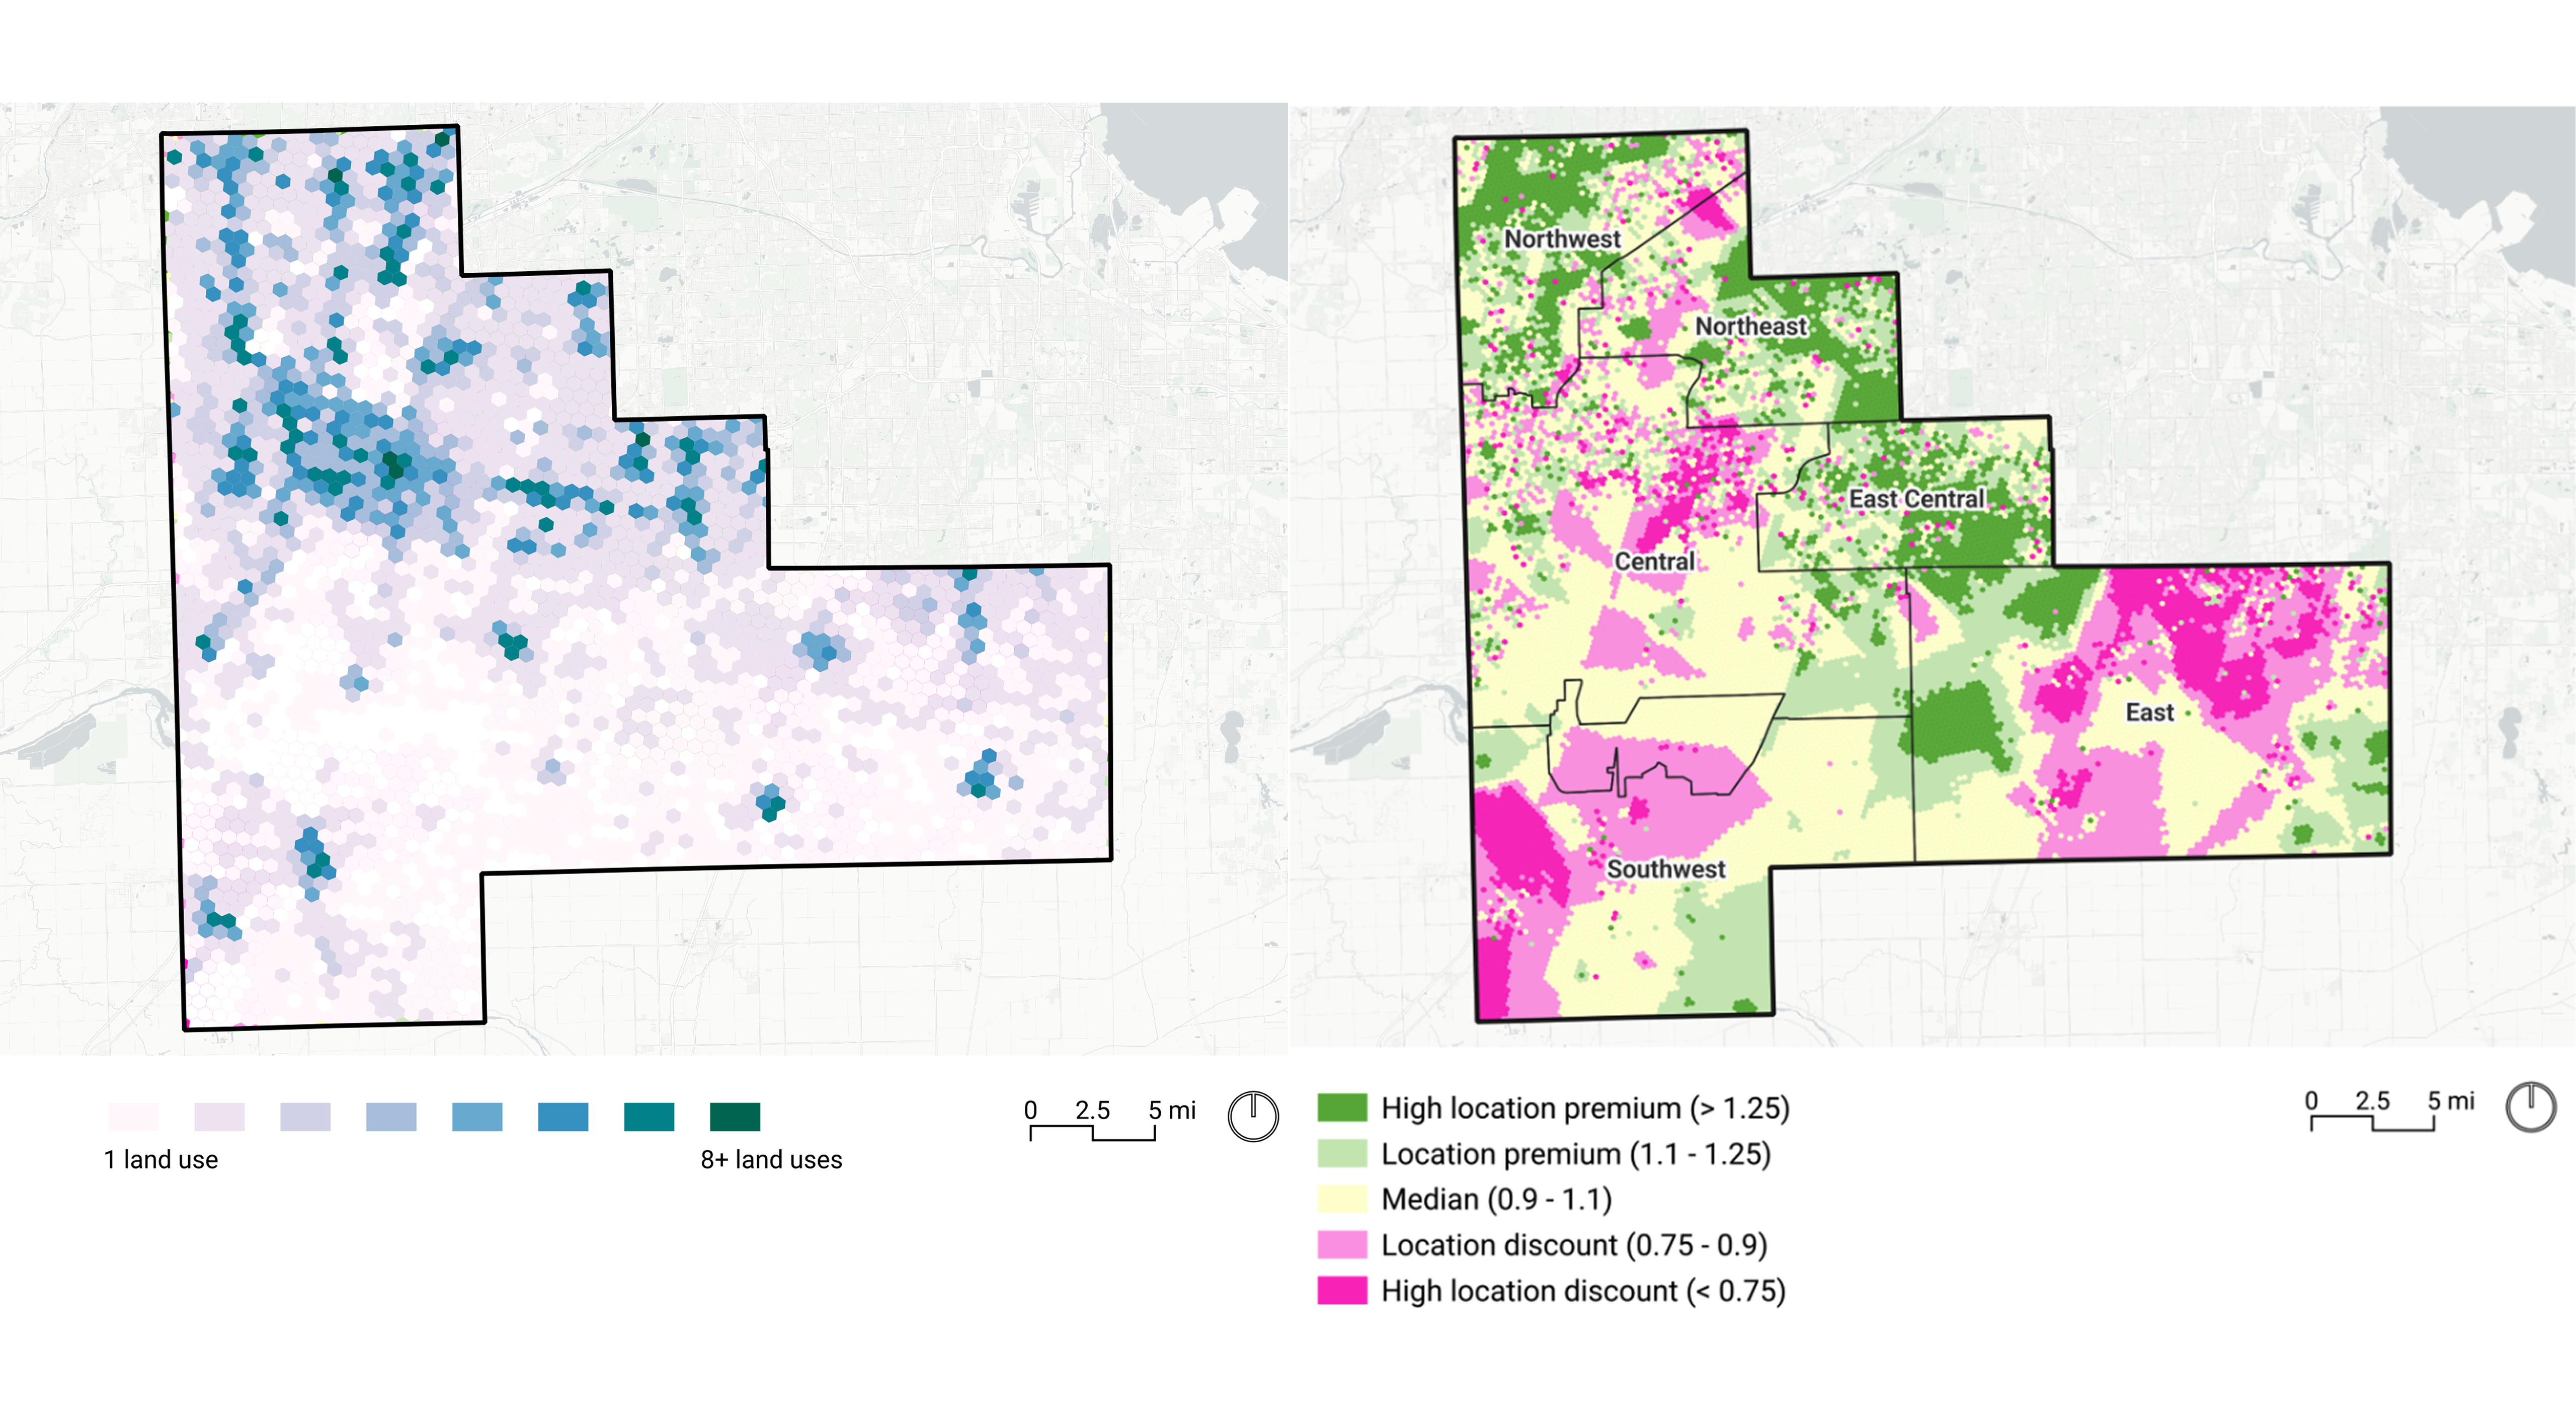
To understand access to jobs and amenities across the county, we modeled land use diversity. This analysis predicts how many distinct land use categories (residential, retail, food/drink, services, office, industrial/utility, mixed-use, civic/exept) are present in a given area, drawing primarily from OpenStreetMap point of interest data. Using a hex grid for more consistent spatial aggregation, the model scores each hex from 0-8 land use categories based on the proximity and density of points of interest, as well as building size and density patterns from Microsoft Building Footprints and Census data. (We built and trained this analysis model for our Central Massachusetts regional housing and transportation study.)

The final layer in our analysis is transportation diversity. This analysis looks at walkability and public transportation access. In Will County, our inputs were a county map of sidewalks, as well as buffers around bus and train service. Local bus service got a .25 mile buffer, while regional commuter train stations that connect the suburbs to Chicago got a 2-mile buffer, reflecting typical usage patterns. Additionally, transit frequency data from CMAP provided an additional input, giving a higher score to transit buffer areas where trains or buses run at least every hour or more.
The result is classified into 6 categories, ranging from areas suitable for low-density residential only, through places with good jobs & amenity access, as well as walkability and transit. In Will County, the places with the highest score were municipalities with historic mixed-use, walkable downtowns, and a train station, including Joliet, Lockport, Romeoville, and Mokena. These places have potential for housing redevelopment that could attract young people. Other municipalities with in the northern and eastern parts of the county, like Naperville, Plainfield, Bolingbrook, and Homer Glen, also scored high – these places have walkable residential neighborhoods and strong local jobs and amenities, but more suburban patterns of development where most commutes and daily trips are made by car.

Most recent development in Will County is occurring in places with a score of 2. These are new single-family home subdivisions on the edge of municipalities that have internal sidewalk networks and public water and sewer, but are located far from any jobs or amenities, and do not connect to transit. This type of development creates more sprawl, which can have other negative impacts, and does not create the kind of amenity-rich smaller homes and rentals that Will County needs.
Premium-Discount Analysis
This analysis measures the location premium or discount on home sale prices: how much more or less a home sells for based on its location, after removing the effects of a home’s physical characteristics like size, age, and number of bedrooms.
Using 5 years of residential sales data from RentCast, the model uses a Spatial Error Model to control for hedonic attributes, so the residual variation is attributed to location. The raw location premium/discount is aggregated to hex cells with distance-weighted interpolation for cells with no sales, and all values are normalized so the regional median is 1.0.

In Will County, the areas with the highest location premium are generally the northern and eastern suburbs, which are located within commuting distance to Chicago and have good school districts. The areas with the largest location discount include more rural southern and eastern areas, as well as downtown areas of legacy cities that have experienced disinvestment, like Lockport and Joliet.
From Analysis to Strategies
Combining these two analyses creates a fuller picture to inform housing strategies. Suitability analysis shows the most appropriate locations for denser, diverse housing with access to jobs, amenities, and transit, but does not address market feasibility. Premium-discount analysis captures those market conditions. Together, they create a geospatial foundation for housing production strategies.

The premium-discount analysis is filtered to only the highest housing location suitability areas (score >=4) below. Areas with a premium will benefit from regulatory changes like increased density to spur housing growth, while areas with a discount may require public investment, support from municipalities, or other subsidies to make development feasible.
For a countywide housing study and action plan, this framework helped distinguish between places where housing production is primarily constrained by regulation and places where market conditions make redevelopment more challenging. Combining these analyses informed targeted strategies that respond to the unique conditions found across Will County, supporting housing growth that aligns with local economic development and workforce needs.